
2 Clear-cut Signals To Take Profits Off The Table
2 Clear-cut Signals To Take Profits Off The Table

I’m a strong believer in the Buy-and-Hold strategy but today I’ll share:
“2 Clear-cut Signals To Take Profits Off The Table”
I used this method to time the top of Bitcoin ($BTC), Monday.com ($MNDY), Cloudflare ($NET), etc. and in this post, I will share 2 things:
How to identify this chart pattern
Two upcoming trade displaying this pattern ($LUNA) ($UPST)
These 2 signals are chart patterns deployed by Market Makers (MM) to induce a bullish impression on retail traders and happen pretty often at market tops/bottoms. This technique can be used aggressively by taking profits, or defensively by not FOMO buying.
This is my most valuable post yet as this technique is highly unorthodox and not taught anywhere else.
FREE SUBSCRIBER BONUS
Upcoming Trade #1 ($LUNA)

Once a bearish candle forms and closes below the resistance line drawn, it is an ideal short trade.
Upcoming Trade #2 ($UPST)
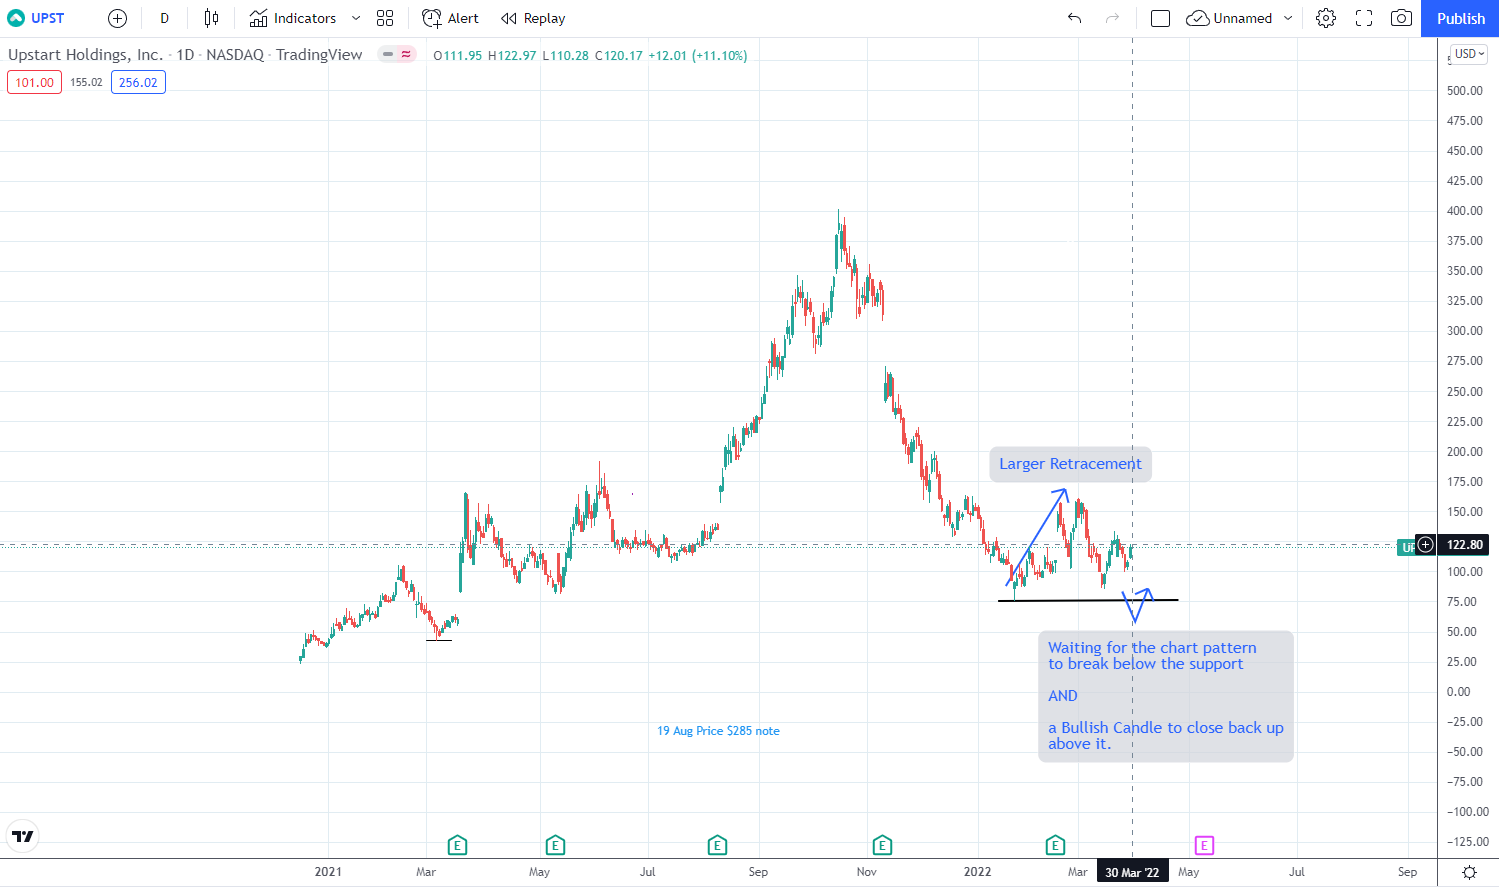
This technique can also be used on the reverse side to time the market bottom.
Background
Lately, I’m fortunate enough to learn how to spot market manipulation from a professional trader who spent 10 years at a prop desk and bagged $3mil+ in profits.
Why didn’t I use this technique on Upstart?
I was very new to this technique at the time between Aug 2021 - Oct 2021, when upstart shot up and I used it wrongly which caused me to sell off way too early. Since then, I’ve picked up the nuances of this technique by observing many other tickers and I’m confident to apply it to Upstart correctly the next time around.
How To Identify Pattern #1
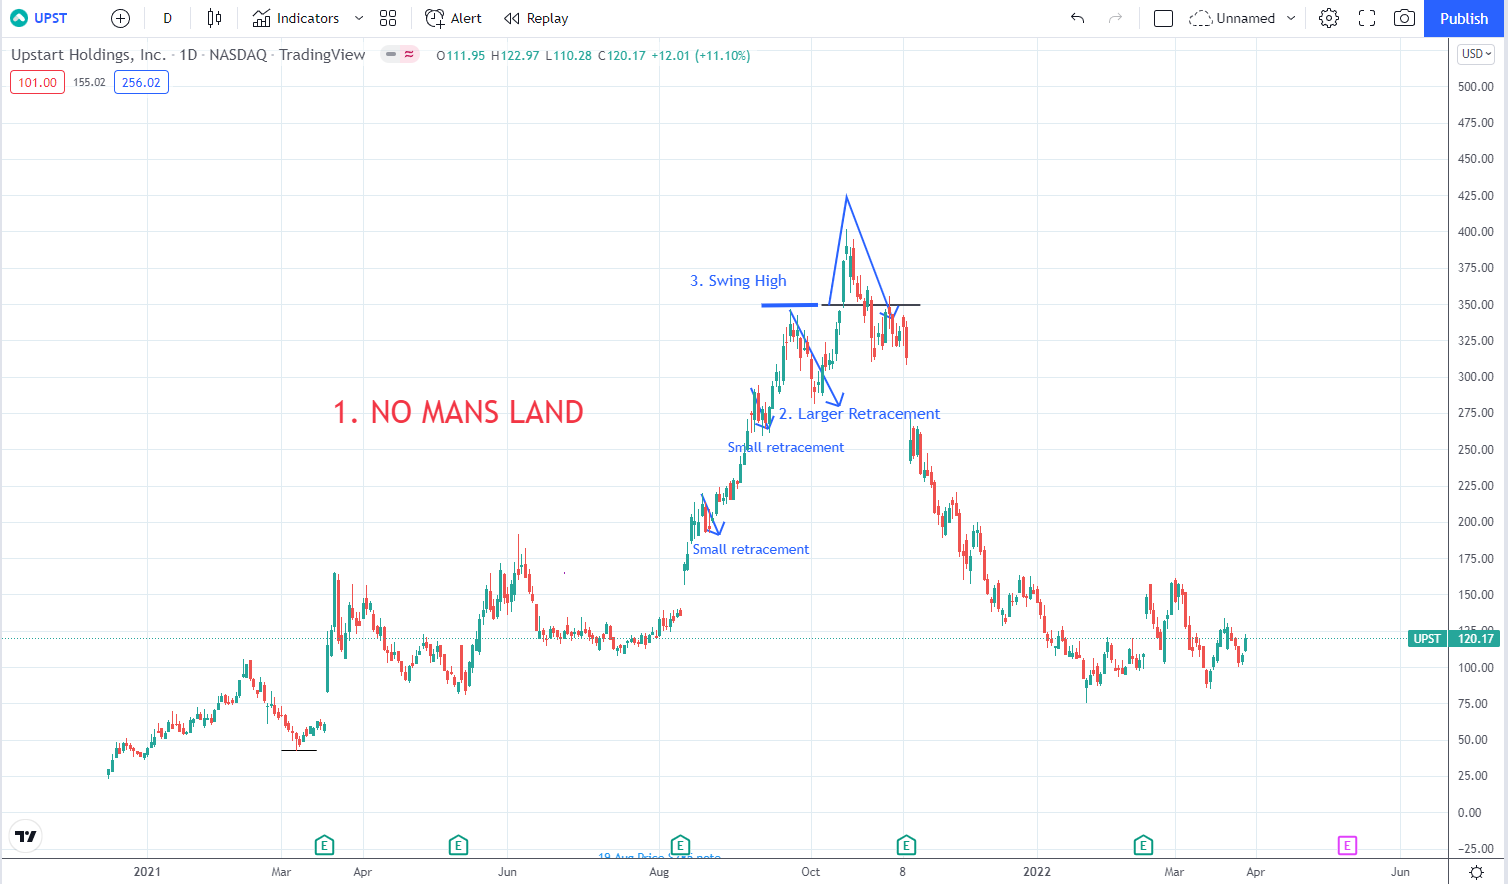
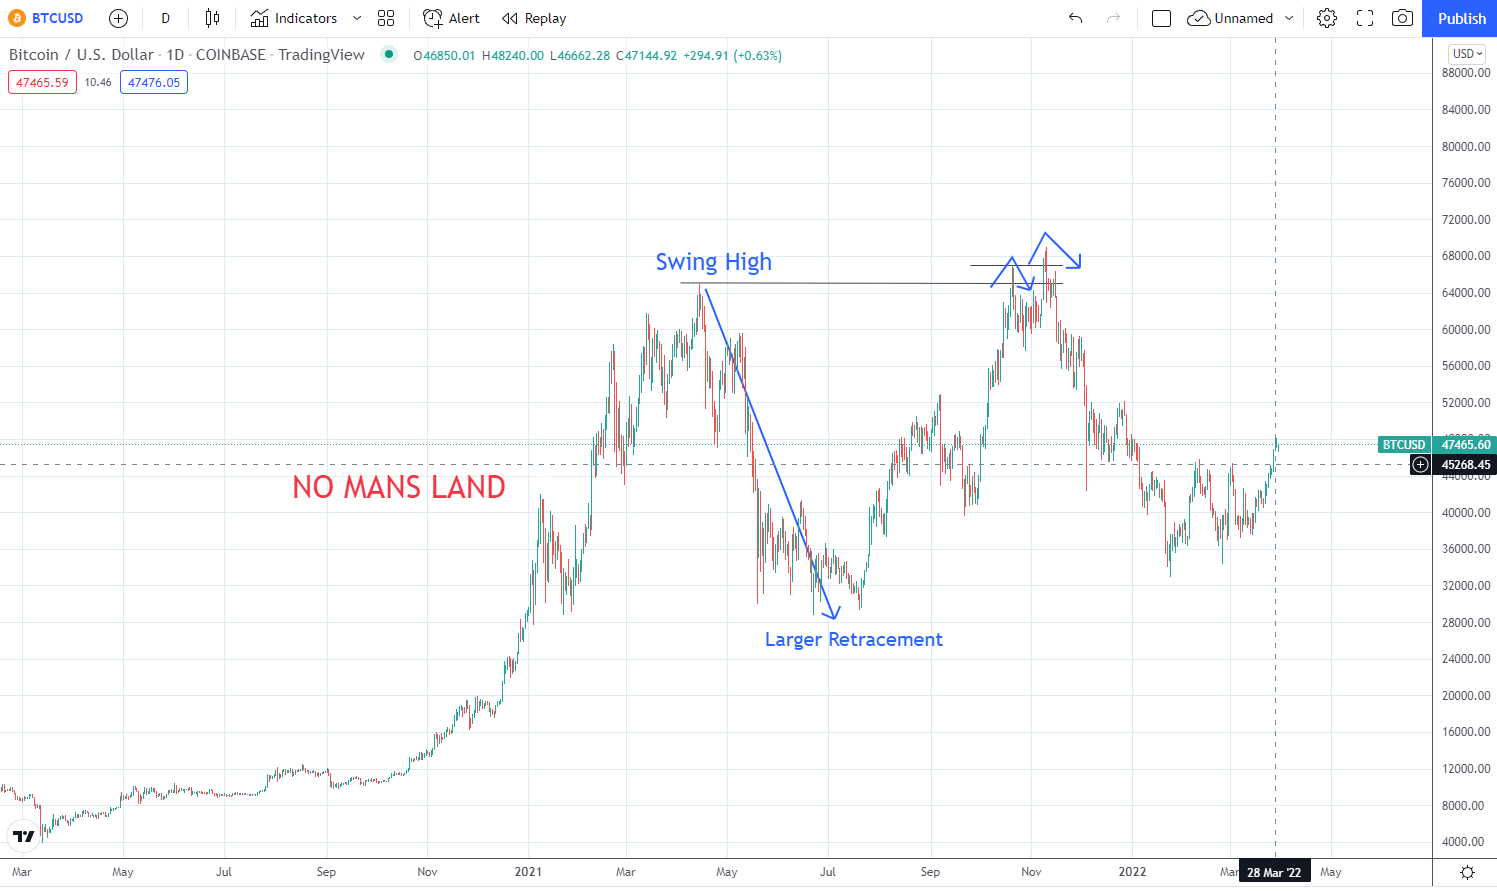
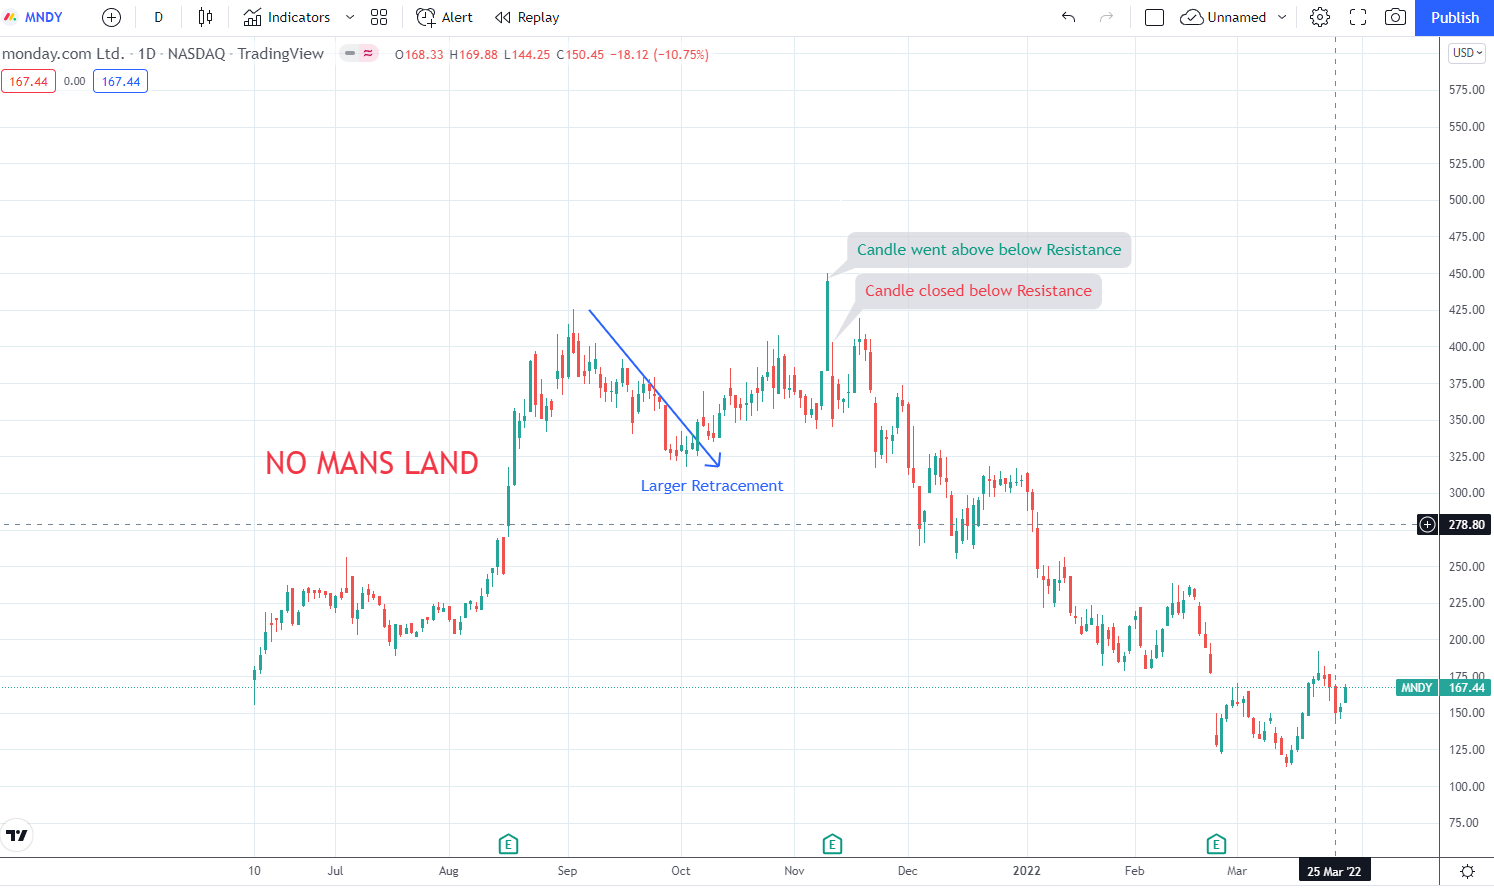
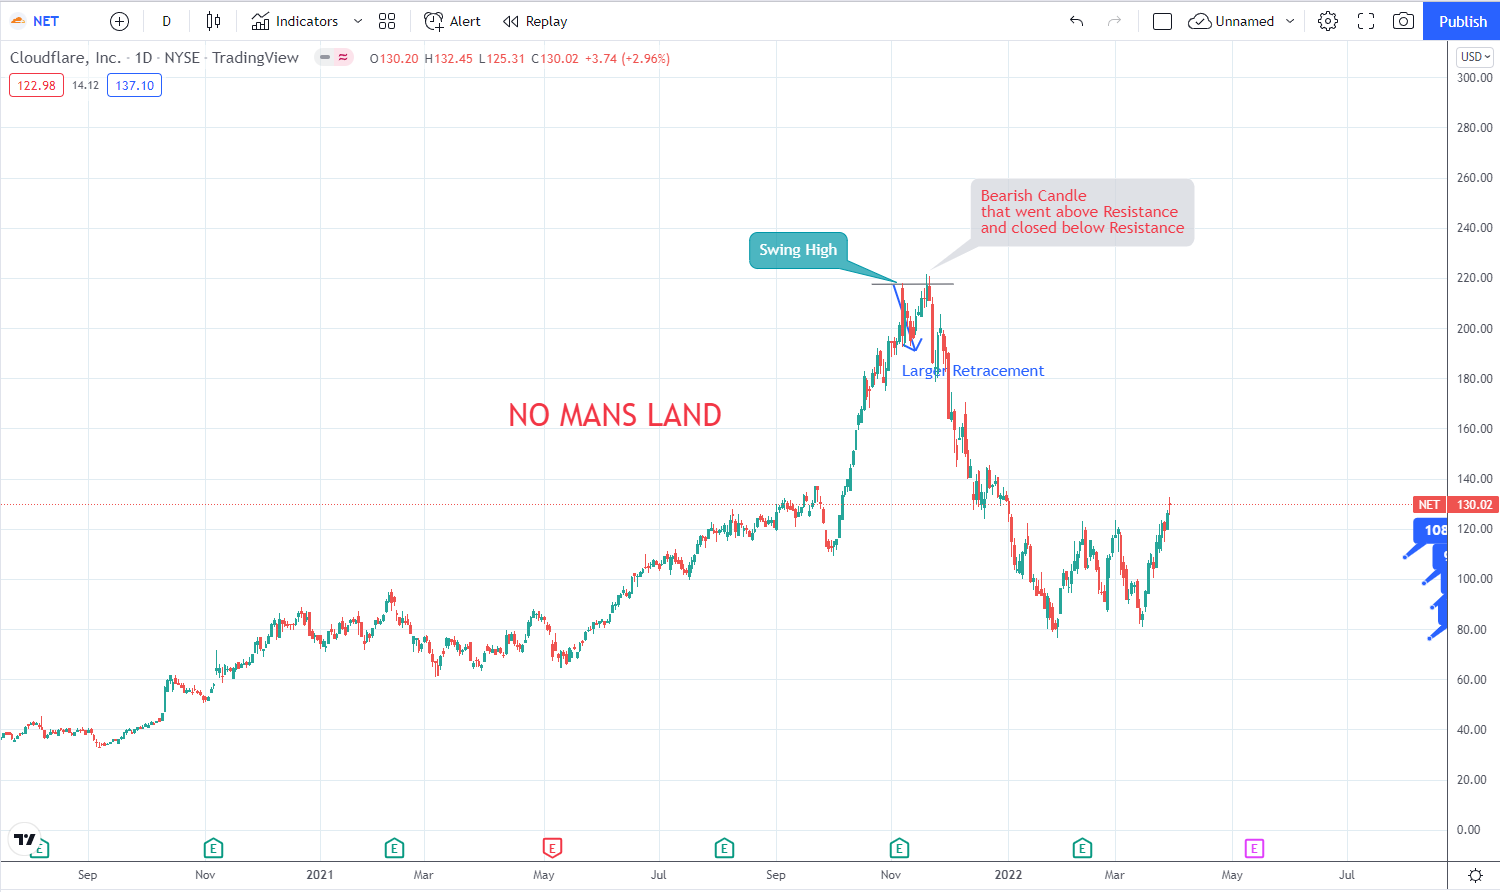
No Mans Land
This simply means there is nothing on the left side of the chart
Larger Retracement
This retracement is larger than all other recent retracements. You only know it is a larger retracement when you compare it with recent previous ones.
Price goes over Swing High and comes back down quickly
(e.g. Within 5 candles)
Once the larger retracement is identified, draw a line at the swing high before the larger retracement. This will act as resistance/support (R/S).
Then, price action must go above the swing high and then we look for a Bearish candle that closes below the R/S line drawn.
If any part of my explanation is unclear, please type it in the comments or dm me on Twitter @lionvesting
Note: Price action leading to the swing high should be STEEP. It should look very strong, sloping up at angles of >70+ degrees.
Example 1: BTC
Example 2: Monday.com
Example 3: Cloudflare
How To Identify Pattern #2
This pattern occurs more with pumped penny/meme stocks.
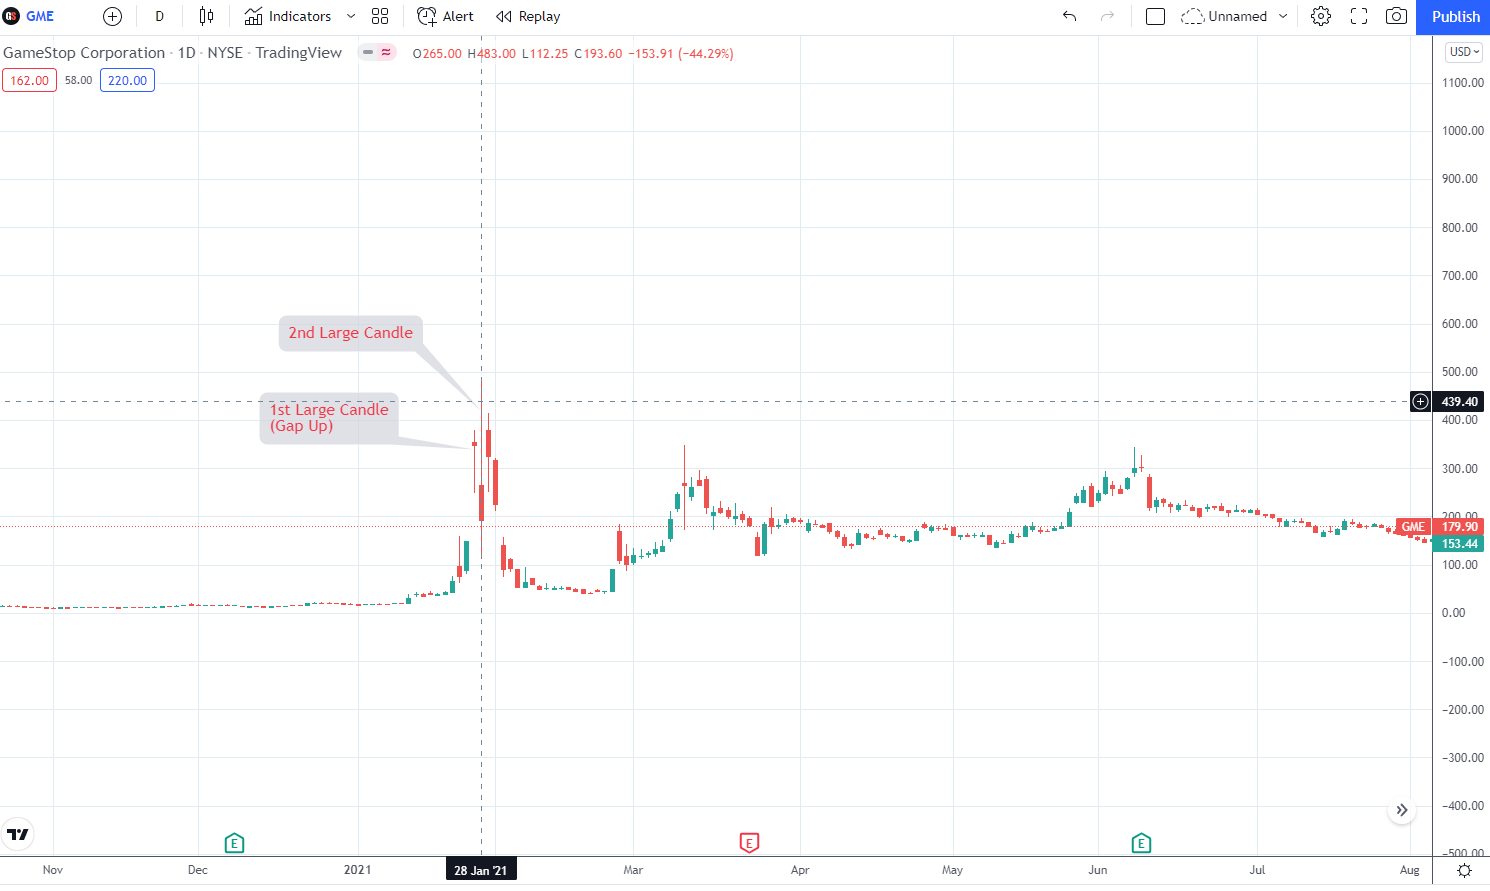
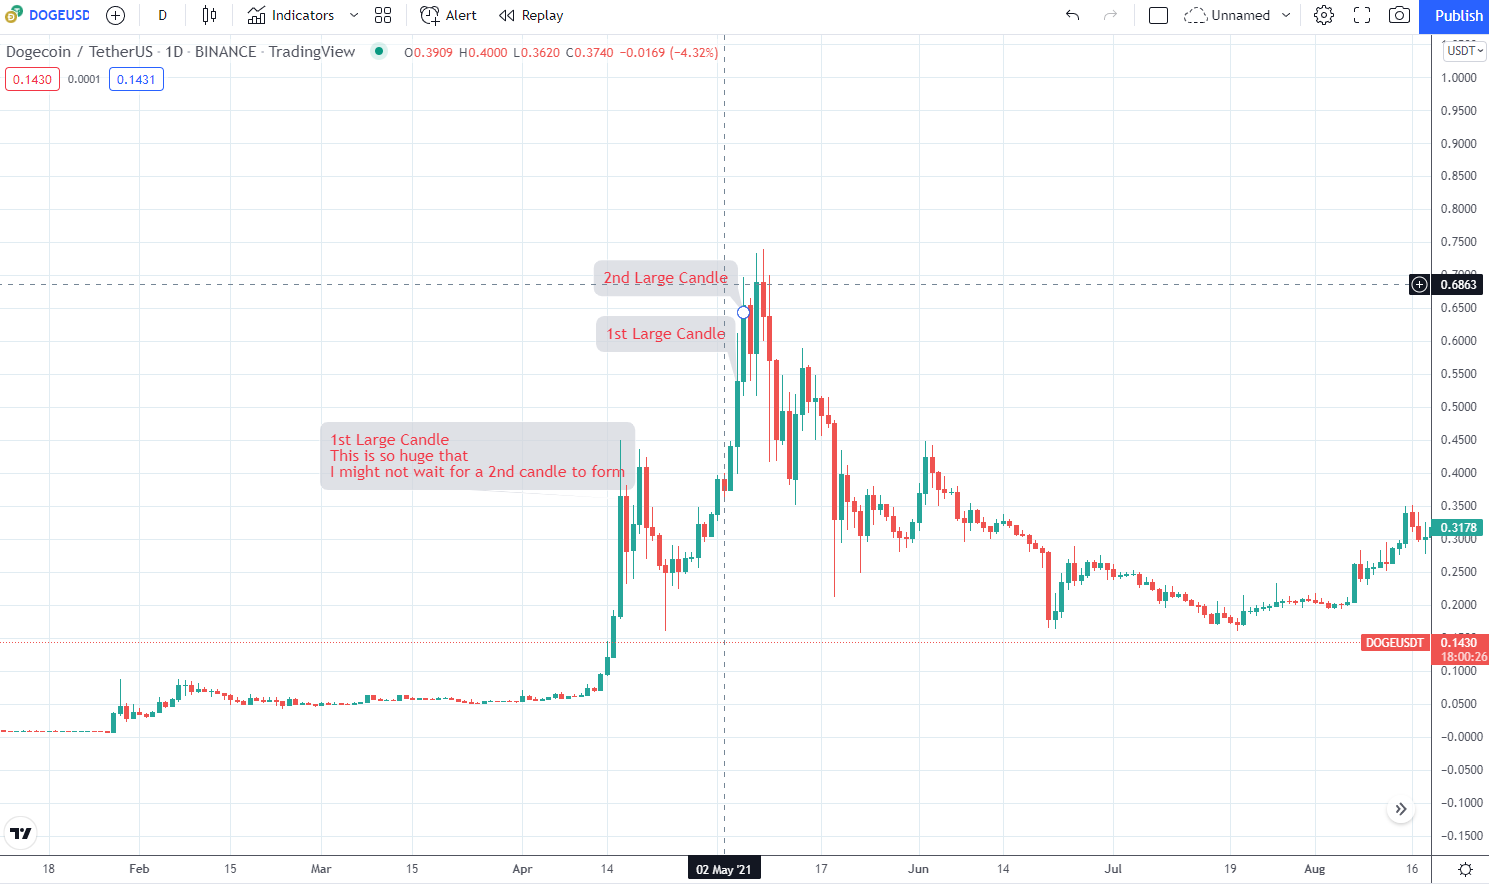
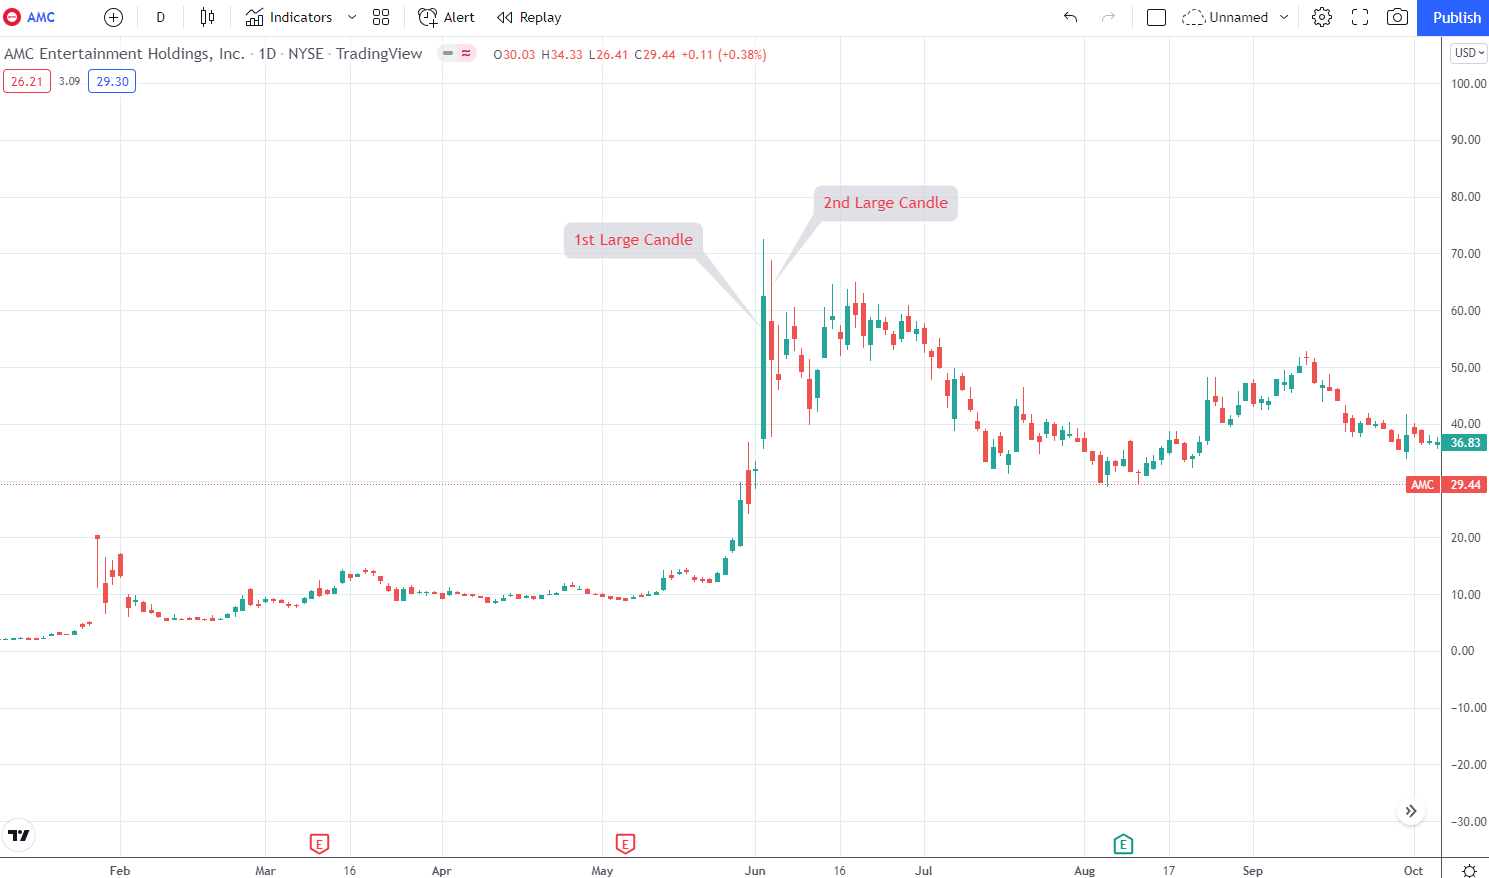
No Mans Land
Extremely Large Candles x2
Take out profits while the 2nd large candle is forming. You do not have to wait for the candle to form fully. We call this the discretionary method of taking profits.
This candle is typically at least 3x larger than any preceding candle. This pattern attracts greedy retail traders thinking the stock is going to the moon.
Note: A Gap Up also counts as an Extremely Large Candle if the gap up is big enough.
Example 1: GameStop
Example 2: Dogecoin
Example 3: AMC
Final Words
Just like any trade, there is no 100% that it will be successful. However, if I see such patterns occur, I will size out about 60%+ of my position depending on how overvalued the stock is.
Where will I Re-Enter? 50% or 61.8% Fibonacci retracements can be a good start and it varies depending on the stock, the valuation, market conditions, etc. Alternatively, you can re-enter at your own discretion.