
Indicators that suggests Market Tops/Bottoms & Recessions
Indicators that suggests Market Tops/Bottoms & Recessions

In no particular order, here’s a list of indicators that suggests market bottoms/tops, and some recession signs. This post will be updated in perpetuity as I come across new indicators.
Market Tops / Bottoms
1. Insider Buy/Sell
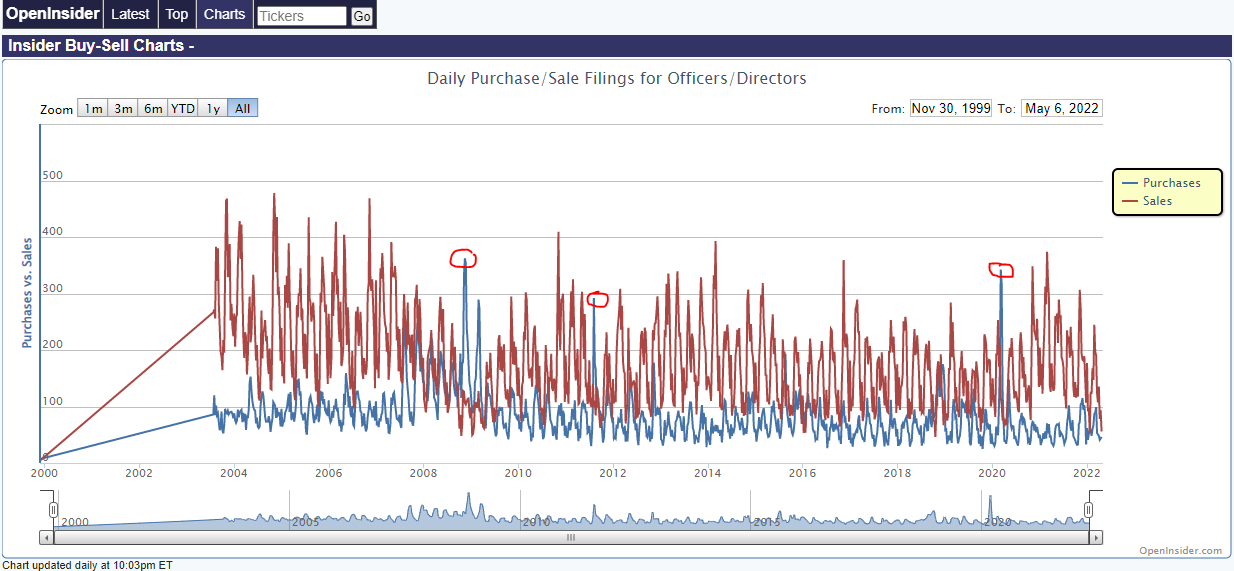
Idea is that insiders know something we don’t. Be it when the stock is undervalued, when FED policies will turn dovish, or when market makers’ books are net-long, etc.
Who knows what insider buying could mean? But I believe that they are smart money and I will lean toward their side. Besides, if you look at the 3 spikes in insider buying, it has coincided with market bottoms.
2. Cash on Sidelines
FMS average cash level (% of AUM)

Source: BofA Global Fund Manager Survey
Typically when cash levels spikes, the market tends to bottom.
An exception is the dot-com crash which lasted Mar 2000 - Sep 2002, where speculative companies with little to no earnings were rampant and valuations were clearly overstretched. In contrast to the present, the companies in the indexes are generating tons of cash and are undervalued. E.g. Apple, Google, Microsoft.
3. Unemployment
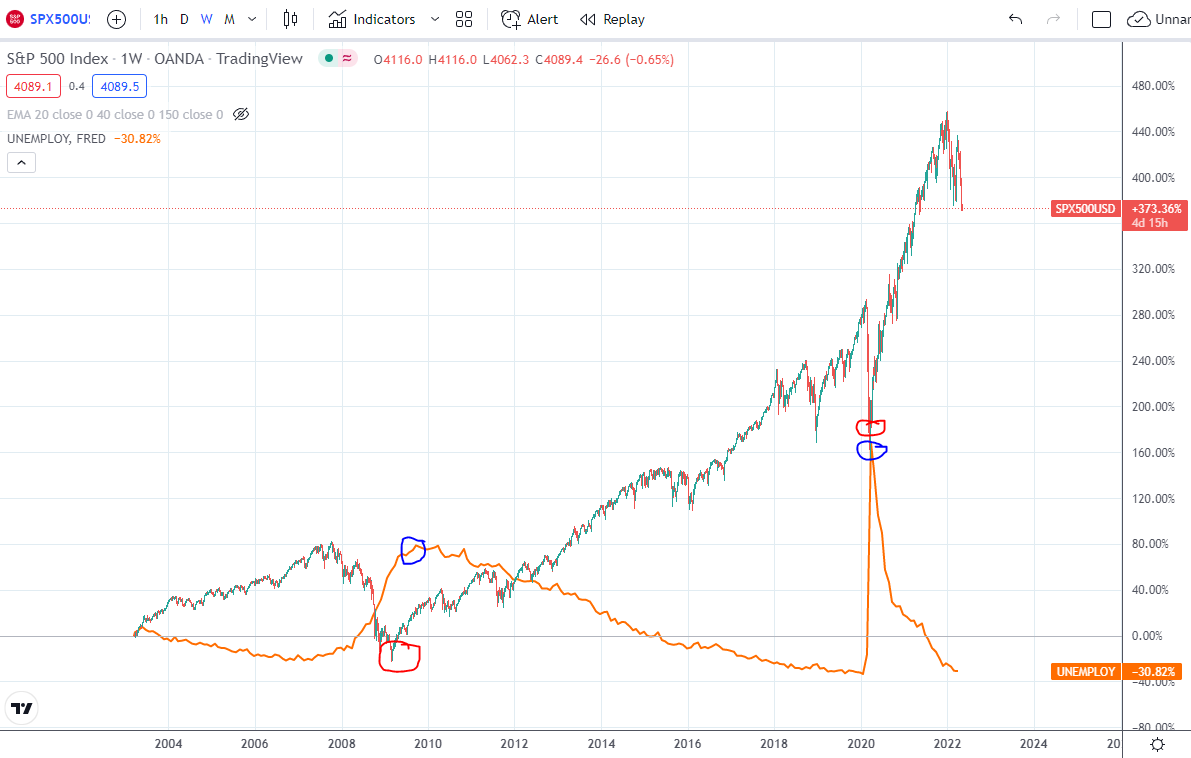
When unemployment goes parabolic / peaks, it signifies a market bottom and the start of a new bull market. This is counter-intuitive at first because naturally, we think stocks are not supposed to go up when the economy is bad. But if you understand that the stock market looks 6 to 9 months ahead, it makes perfect sense.
Since the stock market is always thinking ahead, when the economy is super strong it anticipates a slowdown and the price reflects it (tops out & crashes). Conversely, when the economy is weak, it anticipates a recovery and is reflected in the price (bottoms out & goes up) as well.
4. Investor Sentiment Indicators
AAII Sentiment Survey
Fear & Greed Index
VIX
Put/Call Ratio
Buy fear, sell greed. Standard Warren Buffett quote.. nothing much to say here. These 4 indicators are commonly referenced to measure investor sentiment.
5. No. of IPOs
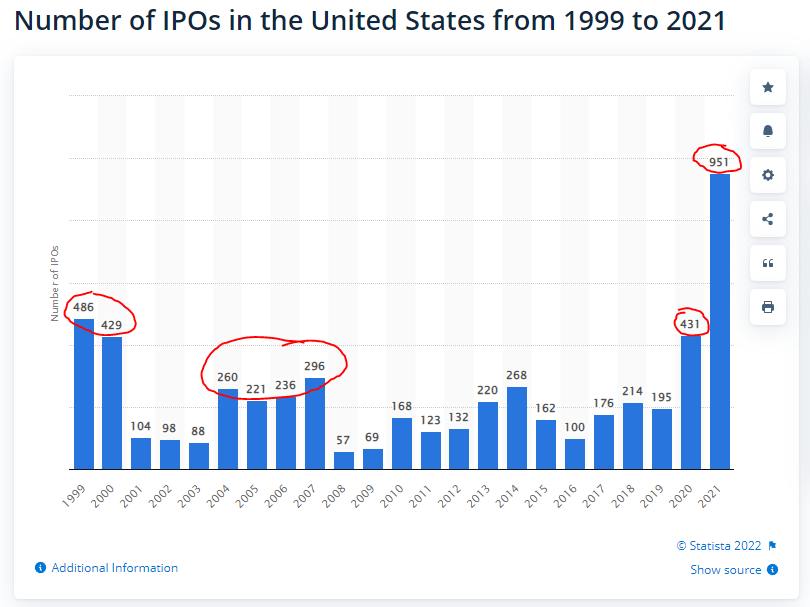
Jumps in No. of IPOs relative to recent years may serve as warning signs that the market is getting a little too HOT. Otherwise, why would companies be rushing out the gate to secure IPO funding right? This indicator may be too early sometimes like in the case of 2004 when the crash only happens 3 years later. Note that while the average No. of IPO is 238, the number of IPOs exceeding 238 is not as concerning as the jumps/spikes relative to preceding years.
6. TIPS Outflow
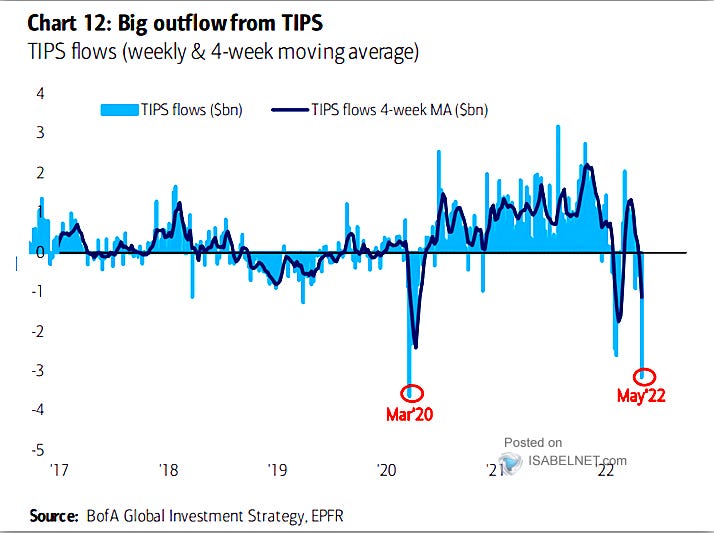
A huge move away from safe bond assets could mean investors are shifting to equities. Note that we only have data from 2017 onwards, hence we cannot determine with a high degree of certainty, a correlation with market bottoms.
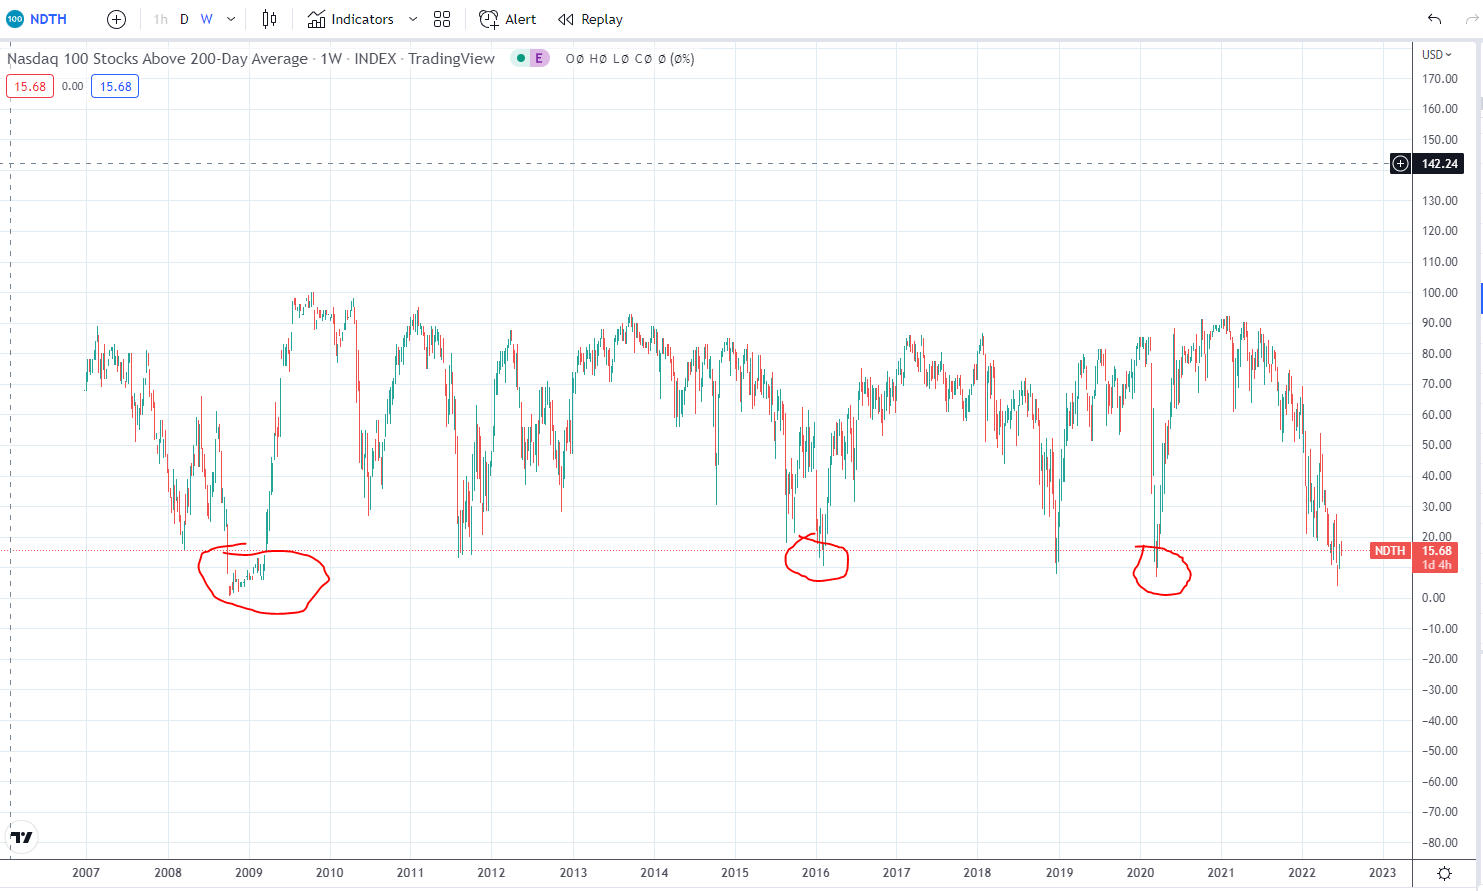
7. Market Breadth

Net new highs reaching -1000 show signs of capitulation.
Other similar indicators are $NDTH, $NDFI, $MMFI, $MMTH. These charts show the % of stocks above 50 & 200 Day Moving Averages.
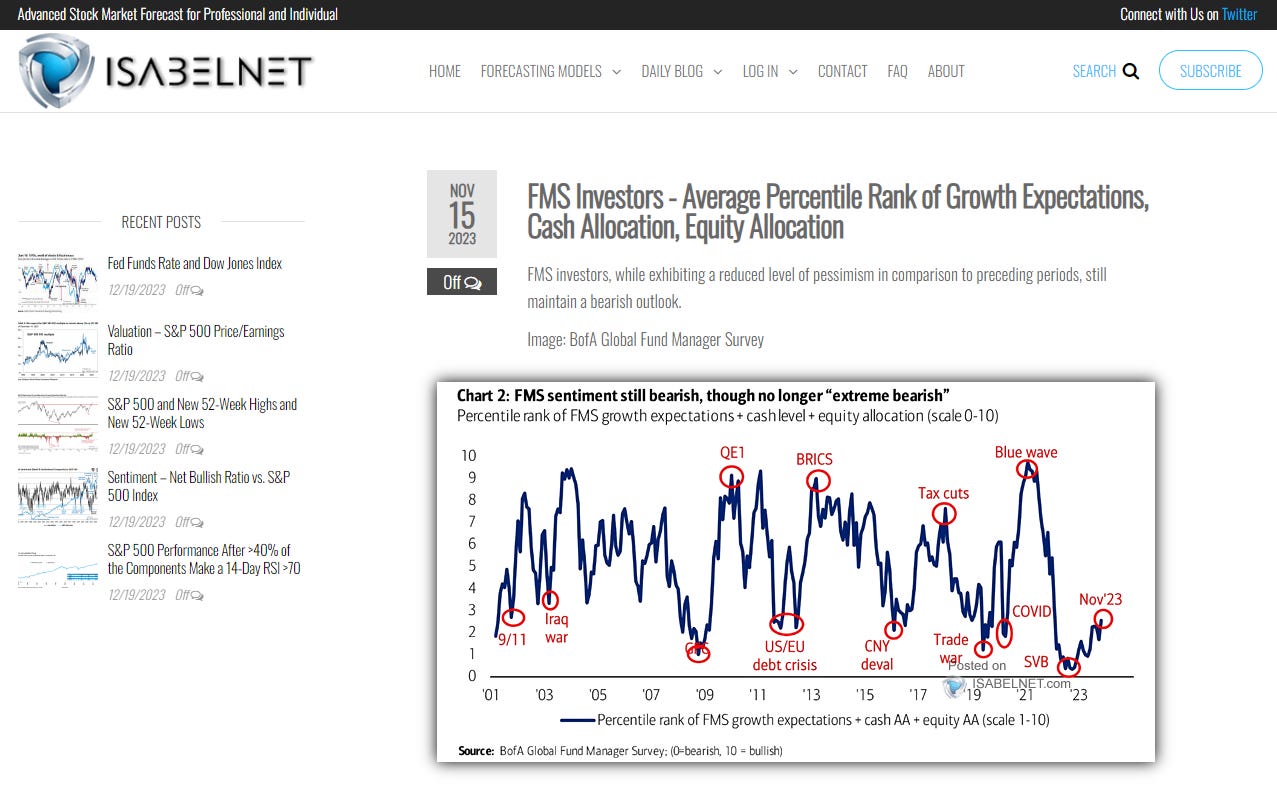
8. FMS Investors - Average Percentile Rank of Growth Expectations, Cash Allocation, Equity Allocation (Added 20 Dec 2023)
Recession Indicators
1. Surging Oil Prices
IMO, the most important chart for the current macro environment is this. Since WWII, almost all recessions were preceded by surging oil prices.
Oil affects everything.
Look around you, everything you see needs oil either along the manufacturing line or import/export line. Goods need oil to be transported, Cars need oil to build and run, and electronic products need energy (which comes from oil) to manufacture. Fun fact, 40% of energy in the US comes from oil.

2. Yield Curve (Mother of all Recession Indicators)
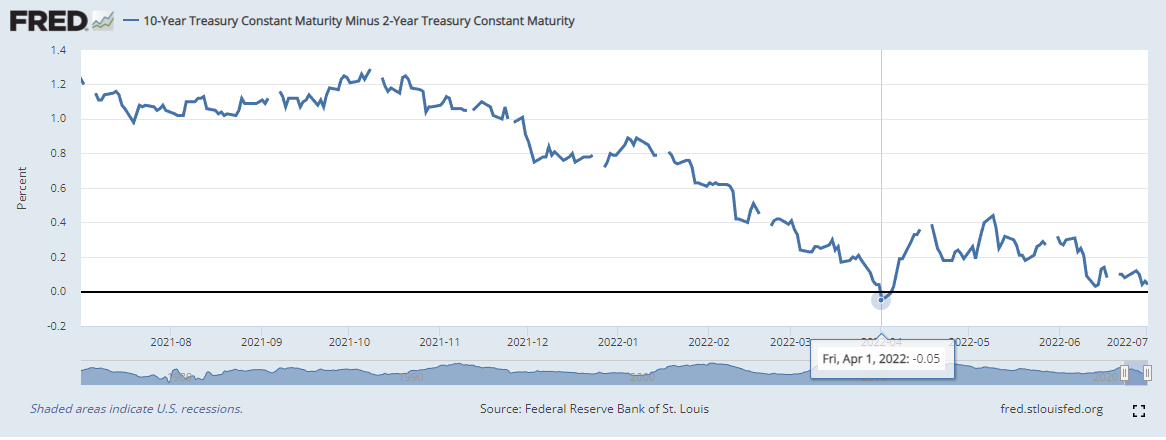
This indicator has correctly predicted the past 8 recessions. Read more in my previous post here.
While the yield curve inversion can warn you of a recession, it won’t tell you when. The average lag time since the 1900s is 22 months and ranges between 1 month to 1.7 years.
For the yield curve to be reliable, it needs to stay inverted for some time, say 1 to 3 months. The recent one only inverted for 4 days.
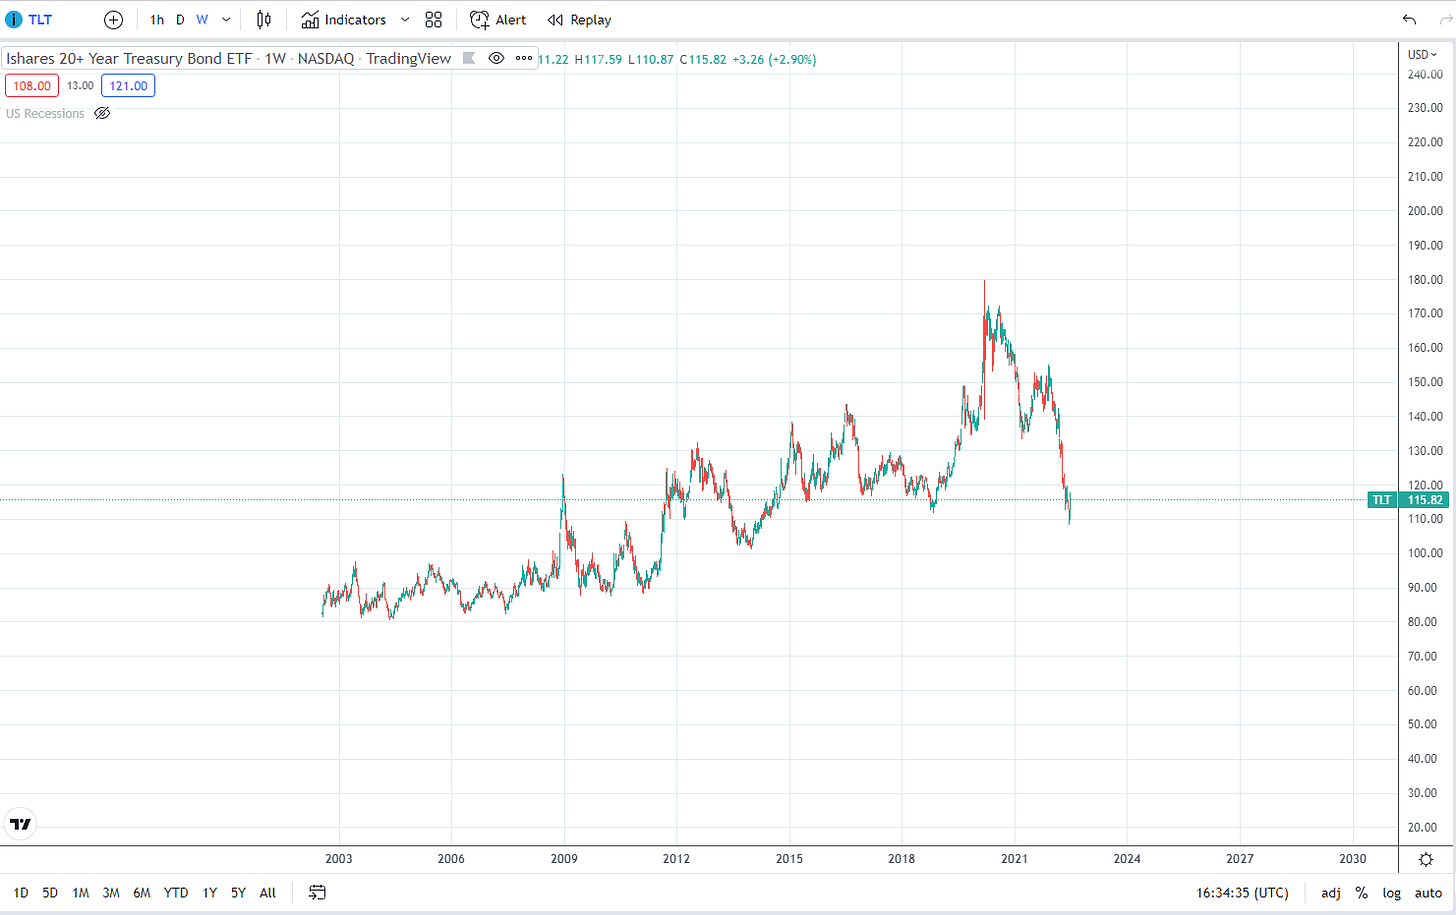
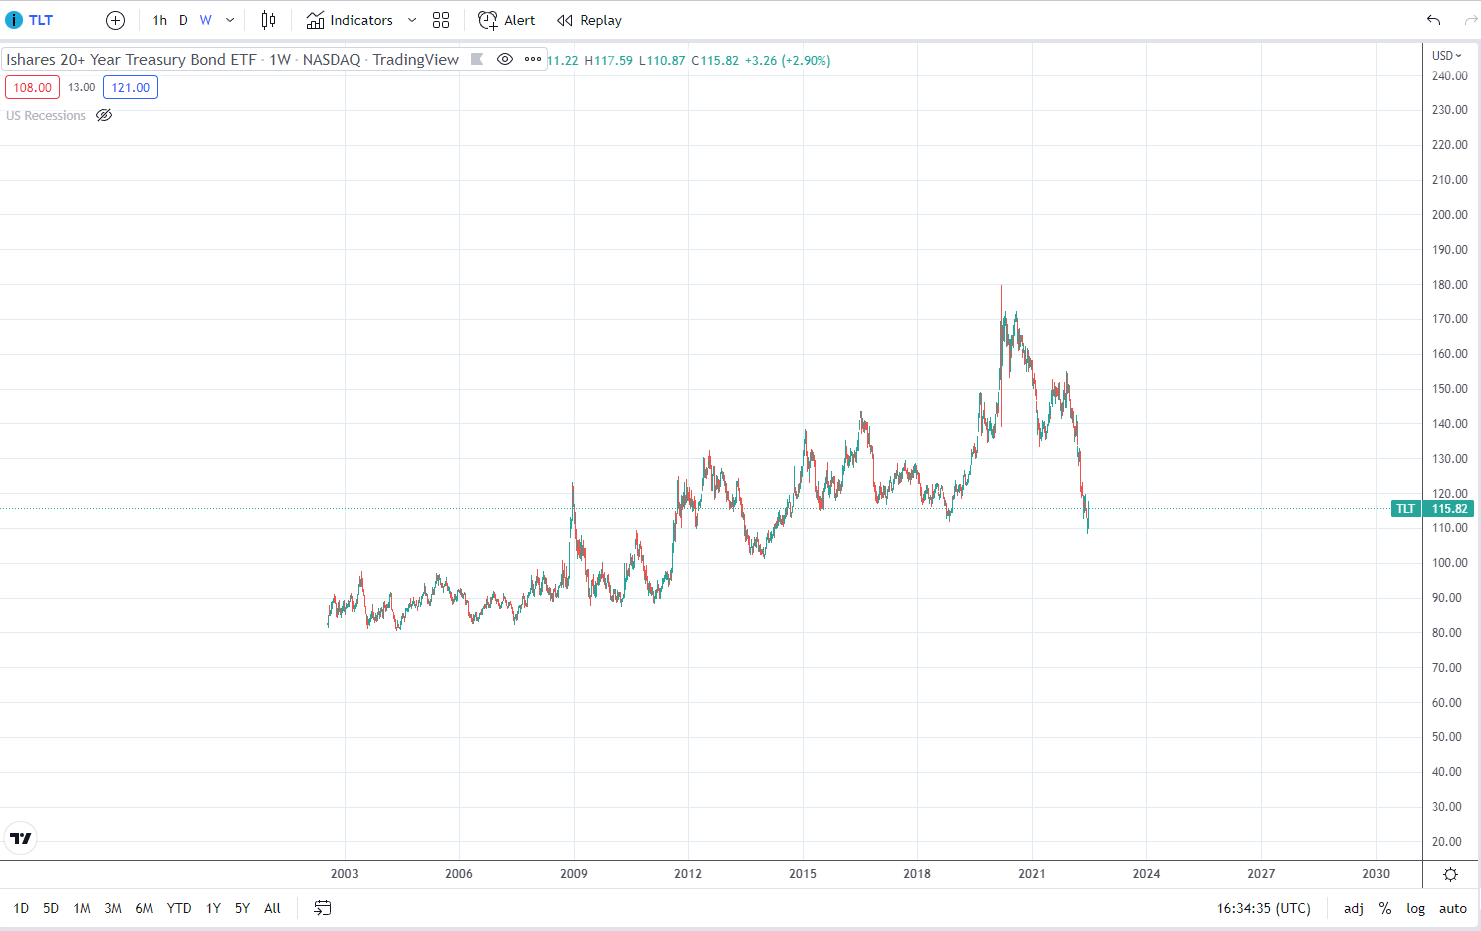
The past few inversions were accompanied by rise in TLT 0.00%↑ , i.e. long-term yields (10Y+) dropping. Right now, TLT is still declining which means the market is not afraid of a recession. However, once it reverses (which to me looks like it’s about to) then shit starts to get real.
Conclusion
Are we in a recession?
Not officially, but it already feels like we are in one and multiple indicators (Oil, Yield Curve, TLT) are suggesting winter is coming. Furthermore, a whole lot of cars are being repossessed, and based on insider news, 2 large tech companies failed to meet sales targets by 30%.
Should we buy the dip?
Not yet, as I see no signs of capitulation in the $NDX and the recession is not officially here yet. Once the recession is confirmed, stocks will rally because it is a forward-looking mechanism so do keep up with the news but use it with a contrarian mindset.
However, if you ever decide to buy the dip, I suggest at least waiting till $NDX reaches $10700.
What stocks might go up?
TLT 0.00%↑ . For those who are more short-term focused, I suggest shorting instead of buying the dip.
Sources to check out
Sentiment Trader
StockCharts
Macro Charts
% of Stocks with MACD Buy Signals
Net Put Value Traded (5 of Market Cap) —> Fear Indicator
Isabelnet.com
IMX vs S&P 500 by TD Ameritrade